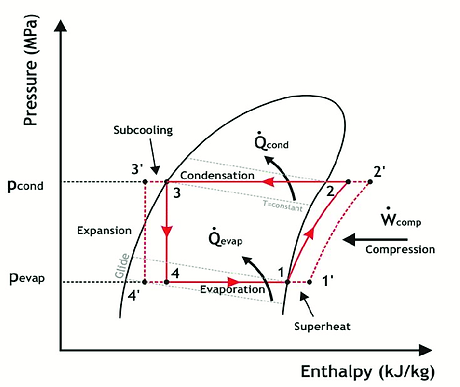
Analysis of Results
The coefficient of performance is a very useful value to obtain. The COP of a refrigeration system tells us how much cooling is provided compared to the amount of work put into the system. A higher COP value means that the system will work more efficiently ideally at a lower cost. During our initial analysis of the system, we made some simplifying assumptions about the system in order to simplify our calculations and the system as a whole. The value we have obtained at this point in the project would be what we would expect out of an ideal Refrigeration Cycle. Some of the simplifying assumptions that we made came both from lecture and from the textbook. The first simplifying assumption that we made was that we assumed no friction affected the flow throughout the system. Obviously, this is not the case but we have not yet discussed how to take friction into account within a piping system. Later, in our further calculations, we will be able to account for the friction and because of this, the COP will go down. As discussed in the textbook, another assumption we made is that there is no heat lost in the compressor and the expansion valve. These are adiabatic processes under an ideal Refrigeration Cycle, but as we know in reality, this is not the case. Heat will always be lost in a system, but we made this assumption to simplify the calculations. Because we have not taken into account the energy losses that would stem from these assumptions, we have a COP that is higher than what the actual Campus Chiller Plant would have. Based on some quick research, the average COP for a typical chiller plant would be around 5. Our initial analysis has given us a COP of 10.175, however, this is not taking into account the energy losses from friction, pressure losses, or heat lost into the environment. All in all, our value is reasonable for the assumptions that we have made and we expect it to decrease as we remove our assumptions, such as friction, and move the system into the real world environment.
Causes of Inaccuracies
Our calculations for each of the processes and heat and work of the cycle have inaccuracies inherent to the fact that we are analyzing an actual refrigeration cycle, not an ideal one. There are many effects that can increase irreversibilities and decrease the overall efficiency of the system, and which can cause differences between our calculated values and the actual values. For example, because the water is pumped over from the condenser to the cooling towers and then all the way back to the evaporator, the lengths of tubing cause frictional effects that could be significant to the efficiency of the system, which we didn’t account for in the calculations. Additionally, the expansion valve causes significant frictional losses as well. These are necessary in order to reduce the pressure of the refrigerant, but they also affect the values. We also don’t account for possible heat transfer to the surroundings from the compressor, and even more frictional losses in the process of this component as well. All of these are factors that possibly played a role in the difference between our calculations and the actual values.

Comparison of Results
As part if this mini-project, we were asked to discuss each process and the cycle as a whole for both the ambient temperature scenario and the normal analysis scenario and compare them to the actual process values obtained from the Chiller Plant Data Sheets. First, we will discuss the cycle as a whole. From data sheet 6 given to us by the Chiller Plant Director Mr. Mike Larson, we found that the total Plant kilowatt (kW) output was 3700 kW. From the first analysis we did (non-ambient temperature scenario), we found the the total cycle output was 4657.59 kW (16.347kJ/kg * 284.92 kg/s). This number is higher than the actual plant output, but this is to be expected because we were assuming ideal conditions in the Refrigeration Plant Cycle and have not taken into account the items listed above. As for the ambient conditions, the total output was found to be 3894 kW (13.667 kJ/kg * 284.92 kg/s). Again, this number is slightly higher due to the more efficient nature under the ambient conditions but also due to the fact that friction, heat loss, and other irreversibilities within the system were not taken into account.
Now to look at each process component individually. For the original analysis, the work needed to operate the compressor was 16.347 kJ/kg. This value can be compared to the ambient condition value which was 13.667 kJ/kg. The value under the ambient conditions was lower due to the fact the the heat going into the evaporator was higher under ambient conditions. As for the evaporator, the heat going in from the environment was higher (169.97 kJ/kg) as compared to 167.182 kJ/kg under normal, everyday conditions. Finally, for the condenser under ambient conditions, the heat leaving the condenser was 183.64 kJ/kg, while under normal conditions this value was 183.613 kJ/kg. These values are extremely close, but the slight variation is caused by moving the enthalpy of state point 3 into the sub-cooled regime.